MONTH 2023

Screwdriving and Riveting
Labor shortages are driving new demand for automation.
Options for Screwfeeding
Turkish automotive OEM TOFAS is using AI to predict loosening in bolted joints. Photo courtesy TOFAŞ Türk Otomobil Fabrikas AŞ
Can AI Predict Loose Bolts in Automotive Assemblies?
Birtan Güler, Ph.D. // R&D Administrator // TOFAŞ Türk Otomobil Fabrikas AŞ // Bursa, Türkiye
While the behavior of bolts under static tensile and shear forces is well known, their behavior under dynamic loading, such as vibration, is less understood.
Many theories have been put forth to explain how a bolt and nut interact under vibration. While these theories have proven helpful in understanding bolt-nut interaction, none are adequate to predict bolt loosening.
Standardized test methods, such as DIN 65151 and DIN 25201, are effective in terms of performance evaluation for single bolt and nut types. However, the rigid conditions in those tests are not necessarily applicable to bolted joints in automobile chassis. The conditions are different, and the external loads acting on the joints have variable frequency.
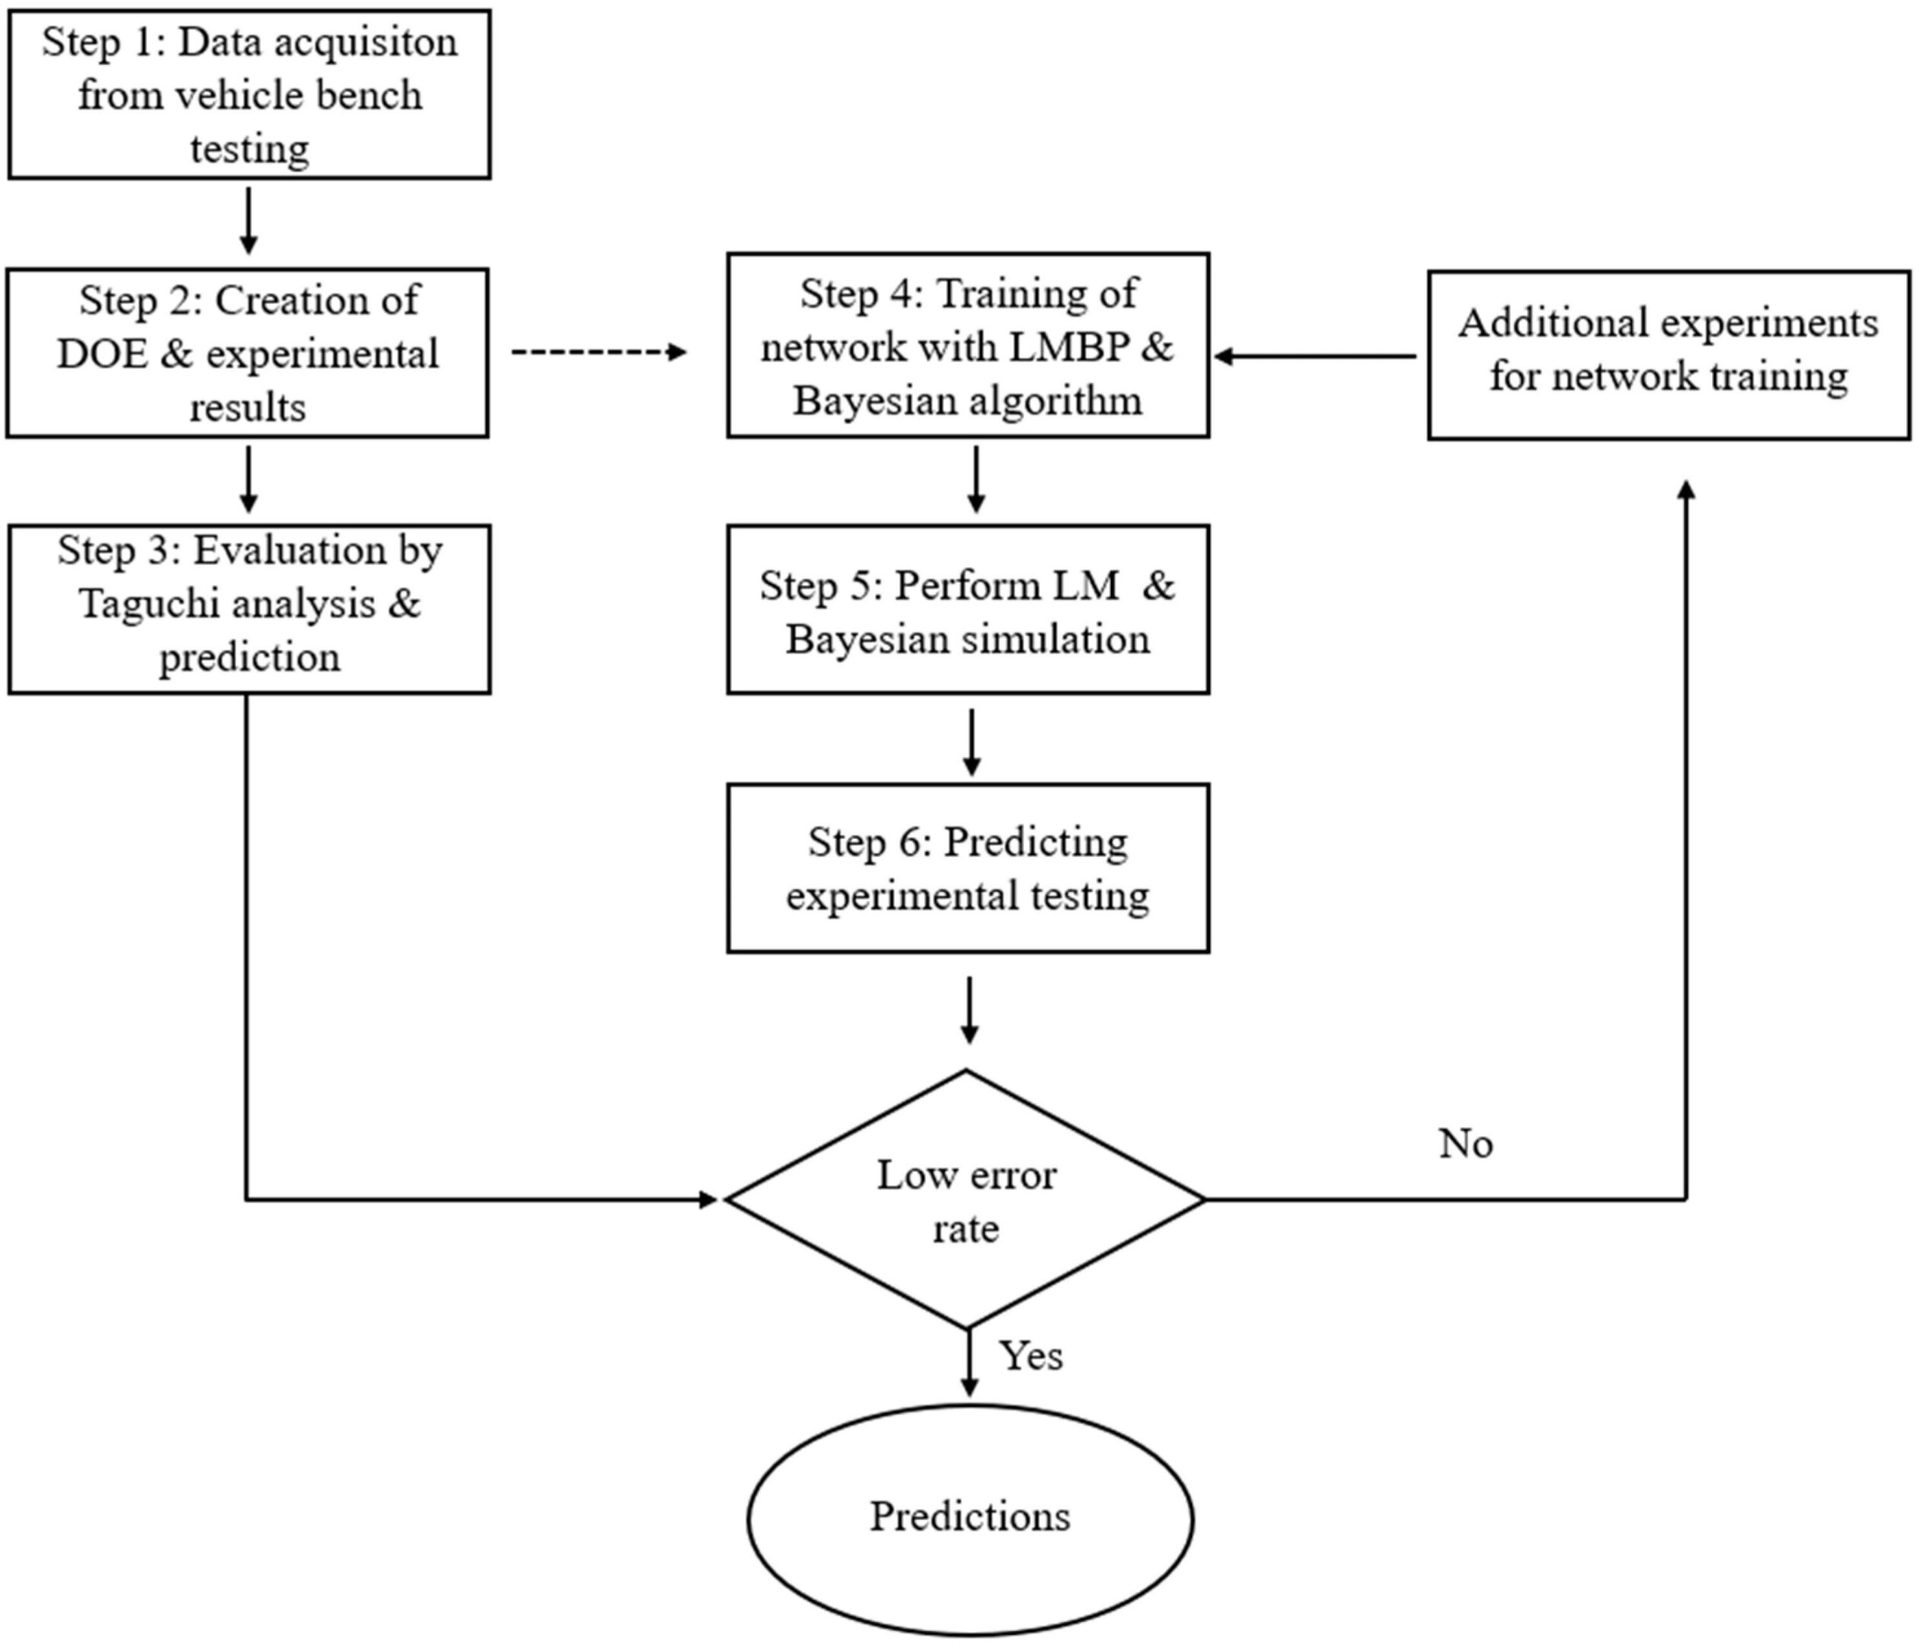
This flow chart illustrates how the researchers developed their AI model for joint loosening. Illustration courtesy TOFAŞ Türk Otomobil Fabrikas AŞ
Several studies have determined the mechanism of self-loosening of bolted joints, but few studies have used artificial intelligence to predict the behavior of bolted joints. We set out to develop an artificial neural network to predict the mechanism of self-loosening and the behavior of bolted joints on engine suspension connections.
Our approach consisted of three steps. In the first step, we collected external loading values from mechanical testing of engine suspension joints. In the second step, we performed Taguchi method experiments with actual joint conditions to obtain training and test data for the neural network. In the third step, we created a neural network with the Levenberg-Marquardt (LM) and Bayesian Regularization (BR) algorithms to create a relationship between the controlled factors and the loosening rate. We then collected the mean squared error (MSE) values to evaluate the prediction errors of the neural network.
The results show that our approach can be used to predict the mechanism of self-loosening of bolted joints without additional tests, and it is possible to make predictions with very low error rates using AI. This promises to reduce the costs associated with testing new bolted joint designs.
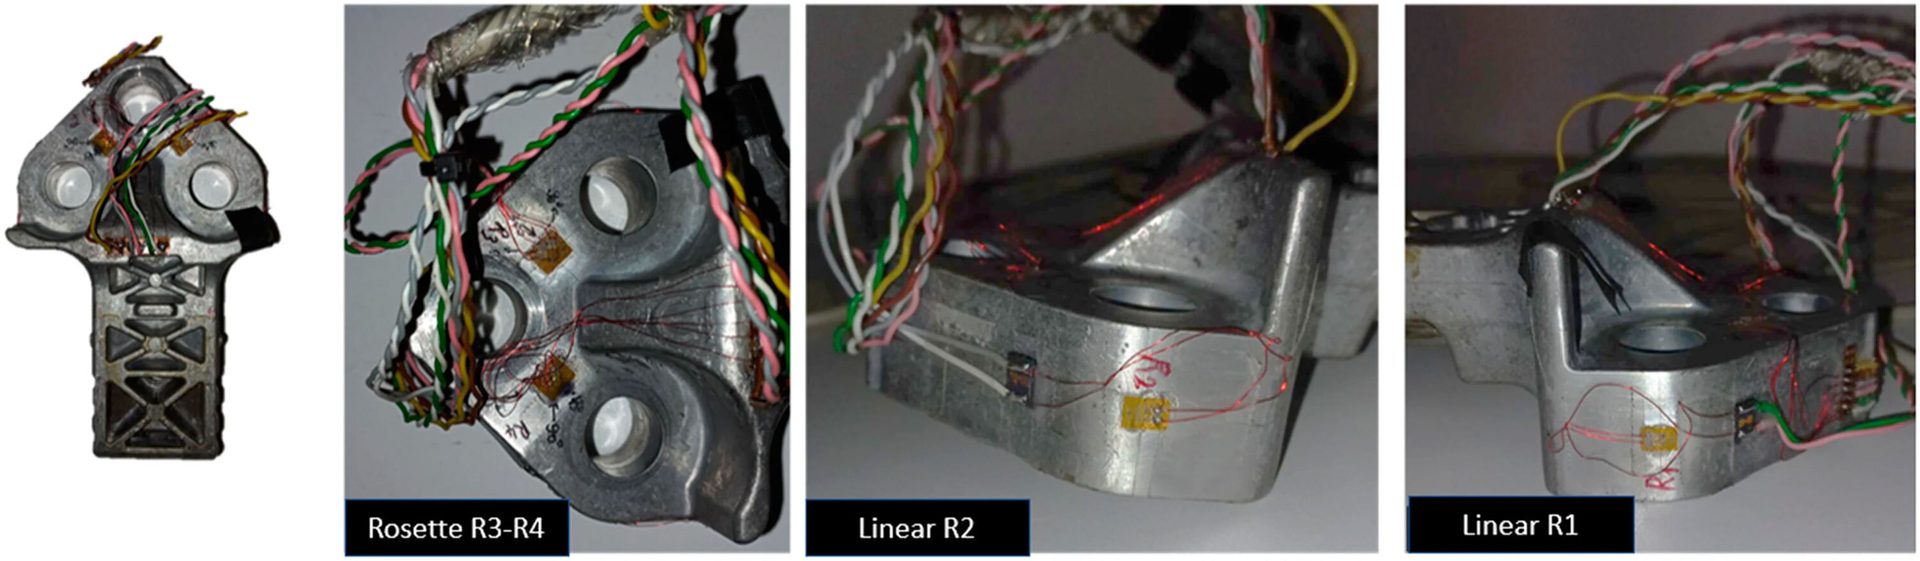
To measure radial displacement levels, four strain gauges were applied to the part near the location of the bolted joints. Photo courtesy TOFAŞ Türk Otomobil Fabrikas AŞ
Bench Testing and Data Collection
Before we could create a neural network, we first needed data on the vibrations acting on engine suspension joints.
To do that, we subjected a vehicular front-end assembly to simulated driving conditions using a test bench. To measure radial displacement levels, four strain gauges were applied to the cast-aluminum engine mount near the location of the bolted joints. Linear strain tensors were used for measurement, and a quarter bridge was used for analysis. The linear strain gauges were named R1 and R2; the rosette strain gauges were named R3 and R4.
In addition, a 100-kilonewson washer-type load cell was mounted to measure clamp load levels.
We used a multiaxial simulation table (MAST) for our tests. The front end assembly was mounted to the test bench plate, and half shafts were mounted to a torque input fixture to apply real gear-change moments to the assembly. Two servo-hydraulic actuators applied the torque.
In addition, the front end assembly was subjected to simulated road vibrations. The vibrations were applied by six servo-hydraulic actuators. Data to drive the actuators was collected from actual road tests on our proving ground.
The front end and vehicle engine were located on the test bench. The instrumented part was located over the gearbox mounting support bracket.
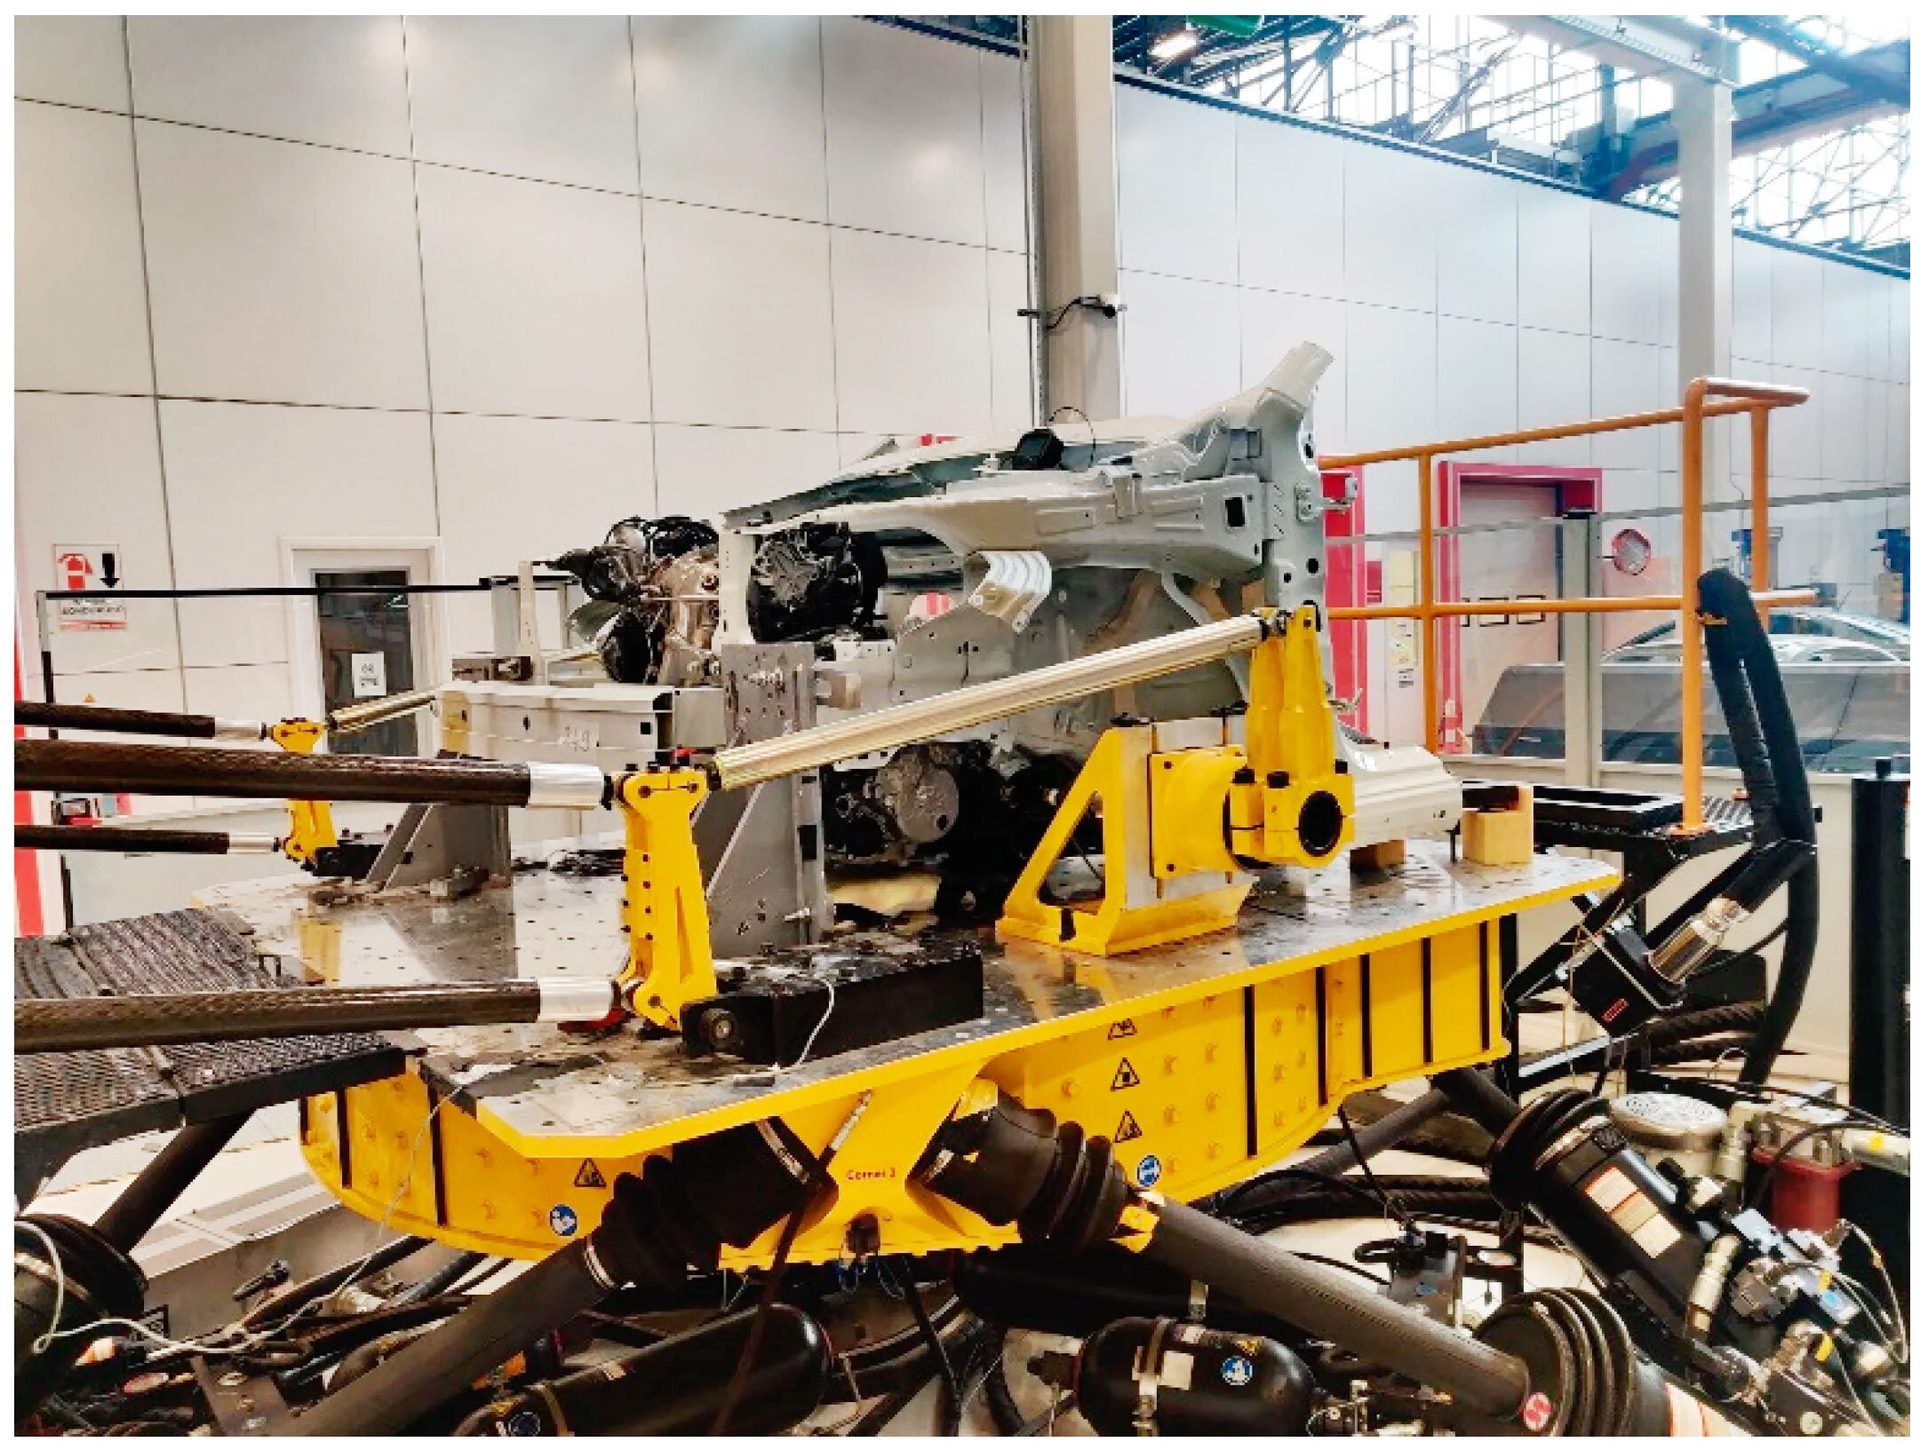
We used a multiaxial simulation table (MAST) for our tests. The vehicle front end was mounted to the test bench plate, and half shafts were mounted to a torque input fixture to apply real gear-change moments to the assembly. Photo courtesy TOFAŞ Türk Otomobil Fabrikas AŞ
Analog signals were collected from the hydraulic system, and displacement control was implemented by checking feedback from the analog inputs. In short, the system was used as the input to control itself via acceleration.
To check the convergence between the road and bench responses, the main outputs were the engine mount body side, engine mount engine side, and front body rail accelerations, as well as the torque strut load and half shaft torque. To follow the fastener deformation level, the component response was collected by strain gauges.
In the end, the system allowed the movement of test specimens in six degrees of freedom: X, Y and Z relative movements, and roll, pitch and yaw angular movements.
When the data acquisition was completed, each sensor strain level was analyzed. The Y-axis motion and strain results were most severe on channel R4-0-degrees. The highest radial deformation acting on the connection under bench conditions was 150 microstrain.
The minimum radial displacement value of 0.15 millimeter was set in the monoaxial servo-actuator, which obtained similar deformations for the R3-0-degree and F4-0-degree channels.
The maximum level was determined as 1 millimeter to accelerate the loosening rates and to prevent the parts from being subjected to fatigue fracture before loosening. Above 1 millimeter level of displacement from the actuator, some cracks were observed on the parts. The aim was to see the loosening performance of the bolted joints between 0.15 and 1 millimeter radial displacement.
The monoaxial test was set as the Y-axis. All fasteners were tightened directly to clamp loads of 30,000 and 45,000 newtons with a torque wrench.
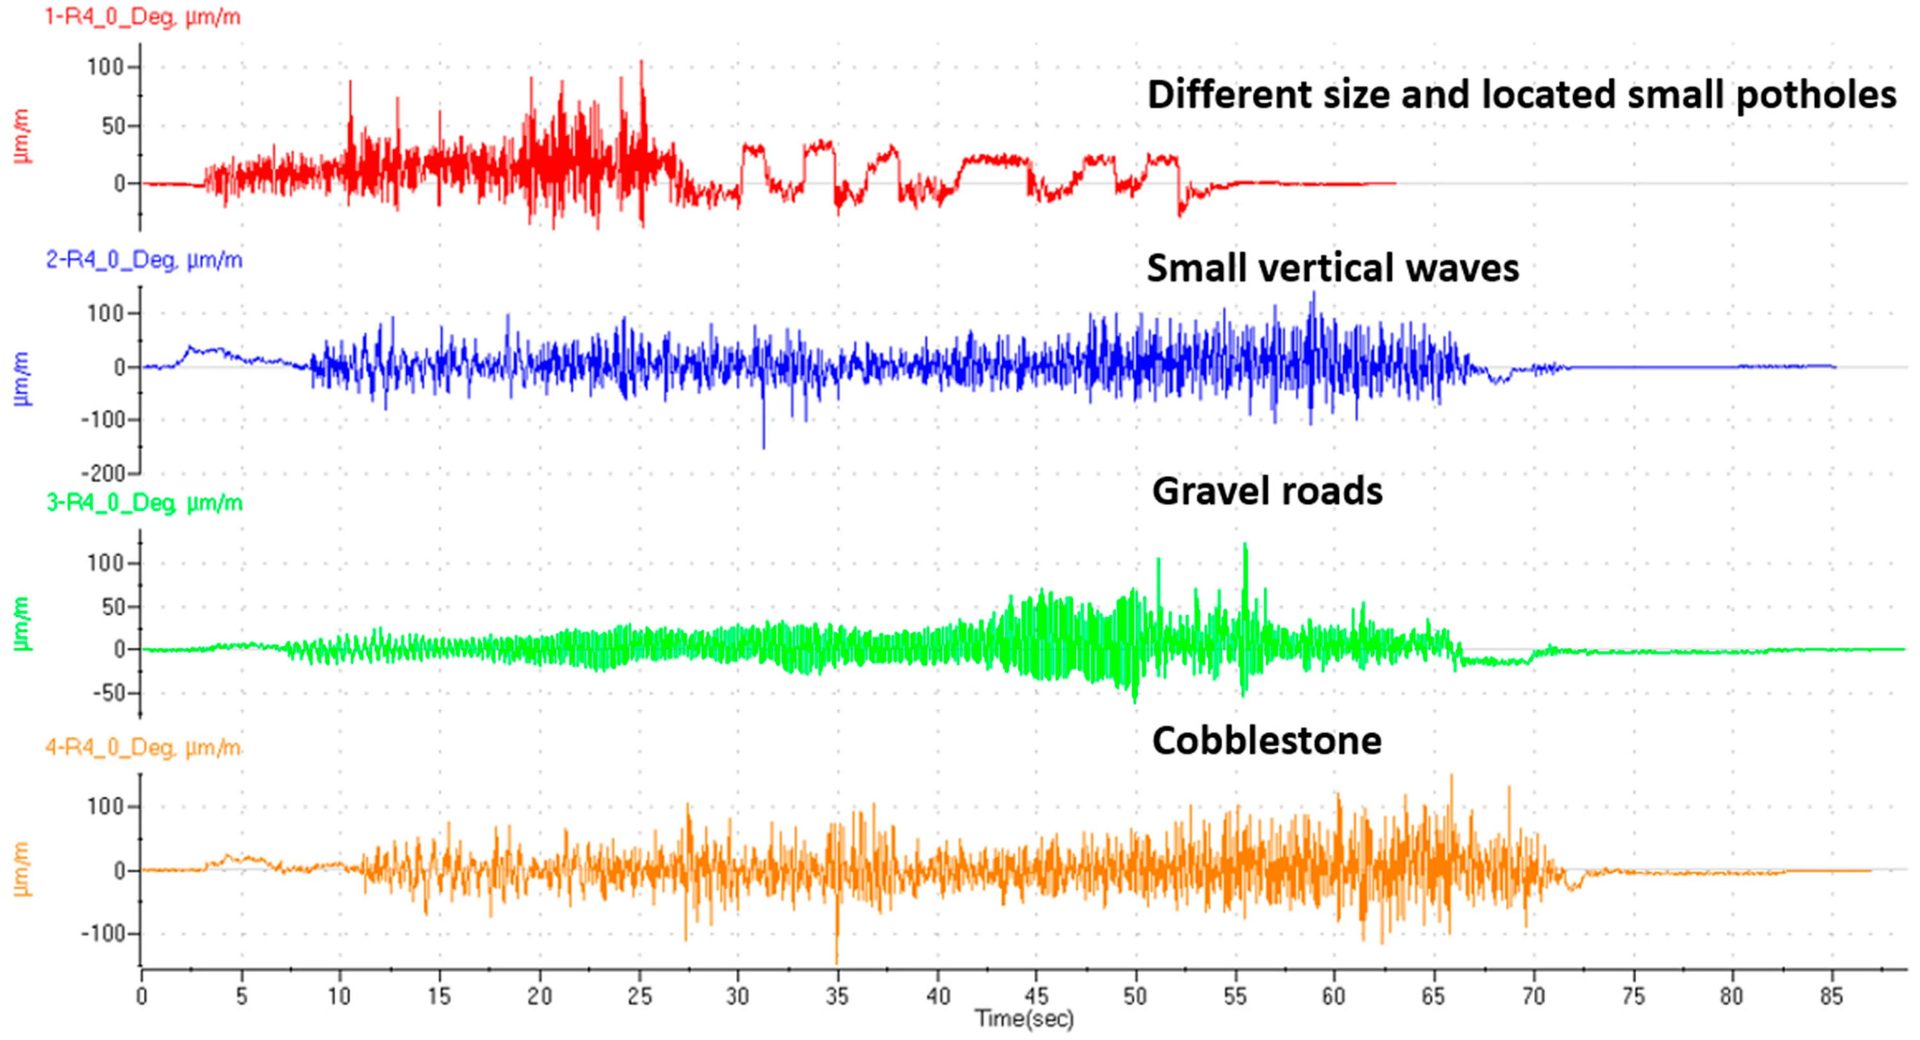
These graphs show the strain applied to the test assembly from four road profiles. Illustration courtesy TOFAŞ Türk Otomobil Fabrikas AŞ
Design of Experiments—Taguchi Method
The Taguchi experimental design method optimizes parameter design with less experimentation. The method aims to reduce the effects of environmental conditions as much as possible and to obtain robust results. According to Taguchi, two types of parameters can be explored: design parameters and noise parameters. Design parameters are those that the designer controls. Noise parameters are parameters over which the designer has no control.
The Taguchi method can be used to determine the optimum settings of design factors to make a neural network insensitive to noise factors. The design of our neural network using the Taguchi method includes the following steps:
• Identification of design factors and determination of objective functions to be achieved
• Description of the experiment set and data analysis procedure.
• Making test sets and obtaining the results.
• Determination of optimal design parameters that maximize signal tone.
• Performing validation experiments for validation.
In our study, seven controlled factors were selected and divided into selected levels. The tests were carried out with M12 × 1.75 × 10.9 bolts with the same geometric properties except for the length. The coefficient of friction, which is the noise factor, was chosen in the range of 0.10 to 0.16 to avoid deviation.
During monoaxial testing, radial amplitudes of 0.15 and 1 millimeter were applied to the assembly at a frequency of 6 hertz. Apart from seven controlled parameters, the bolt pitch was not included in the test parameters because its effect is well known. Locking nuts were not included, because the test was only for blind-hole applications, and the positive effects of locking nuts are well-documented. The tribological lubricant effect was not included in the tests, since oil-treated bolts are not used in this type of assembly.
Metal and aluminum washers, serrated lower female thread parts, and connecting parts with the hole diameter and thickness adjusted were produced to provide the Taguchi parameters, such as clamping length, bearing area, joint rigidity, and surface conditions between parts. The serrated surface of the lower female thread part was processed to increase the friction coefficient of the surface. All materials were renewed after each test.
Taguchi’s orthogonal sequences were determined as the most useful sequence for our experiment. Specifically, the L16 sequence is a specially designed array used to determine only the main effects of parameters. No interactions between parameters were investigated.
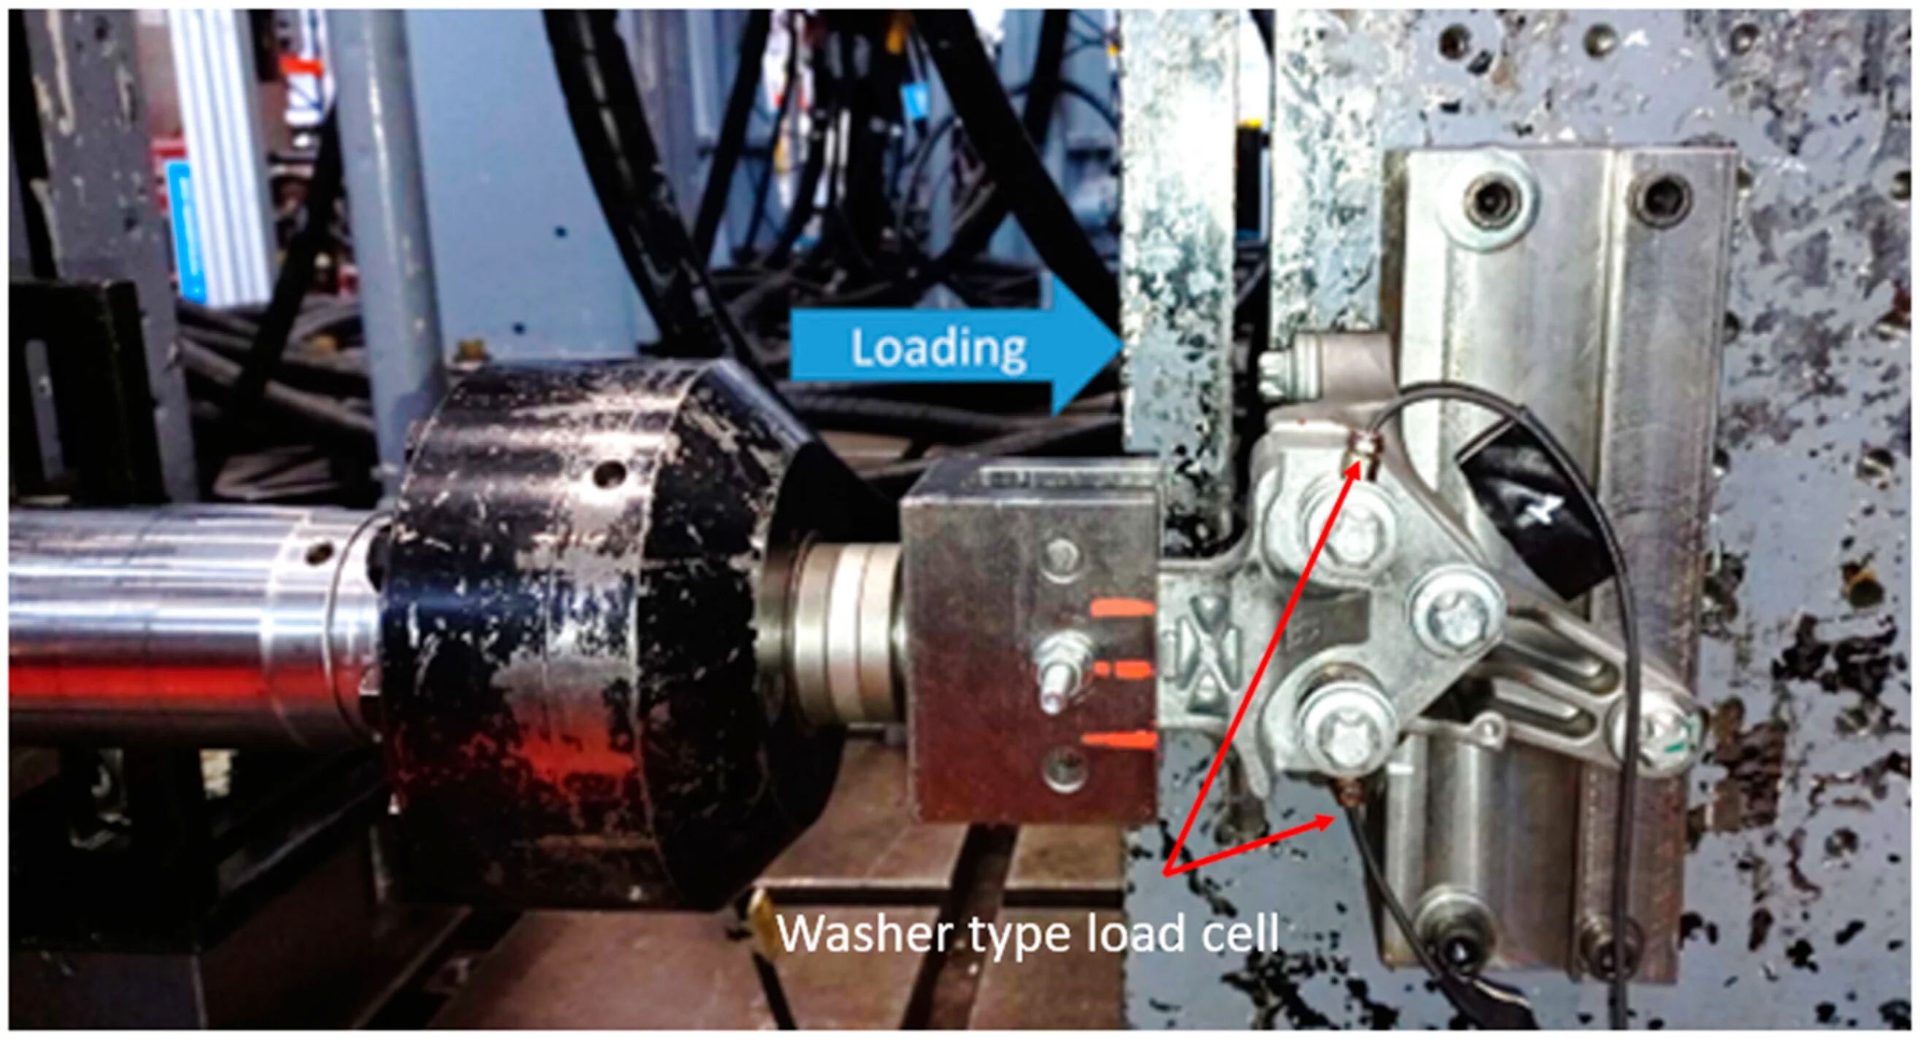
The monoaxial test was set as the Y-axis. Photo courtesy TOFAŞ Türk Otomobil Fabrikas AŞ
Experimental Results and Data Analysis
Monoaxial vibration tests were carred out with actual production parts from a vehicle. Sinusoidal cyclic signals of 0.15 and 1 millimeter were applied during tests. A total of 16 tests were carried out within the scope of Taguchi experimental design, and three additional tests were applied at the minimum, maximum and nominal Taguchi levels. Each experiment was stopped when the joint loosened to 30 percent of its preload.
In two experiments, 30 percent bolt loosening did not occur, whereby loosening was assumed at 1 million cycles. Loosening rate values (newtons per cycle) were obtained.
A Taguchi L16 orthogonal experimental design matrix was established in the experimental test, and the signal-to-noise ratios, mean values and effect rank were shared for each input parameter. The signal-to-noise ratio is a measure of robustness, which can be used to determine the input factor that minimizes the effect of noise on the response. The signal-to-noise ratio is an output that compounds the mean and variance. The aim in robust design is to diminish the sensitivity of a control characteristic to noise factors.
A “smaller is better” characteristic was used to judge performance. This is convenient for objectives aimed at diminishing the output or minimizing the target, such as the bolt loosening rate. The signal-to-noise ratio was then calculated for each factor level combination.
The average effect of the radial displacement parameter at Level 2 was −6.968 decibels, while the average effect at Level 1 was 17.362 decibels. The difference between the two levels was 24.33 decibels. It can be observed that the radial displacement parameter was a very influential factor on the loosening rate.
The difference between the levels of the joint rigidity parameter was very small (0.6426 decibel), indicating that this parameter had little or no effect on the response.
The degree of effect of some parameters, such as radial displacement, clamp force and surface condition, was high. A small modification in these parameters would cause a significant change in loosening rates. An experiment using Level 1 radial displacement, Level 2 clamp force, and Level 2 surface condition would work best to minimize the loosening rates.
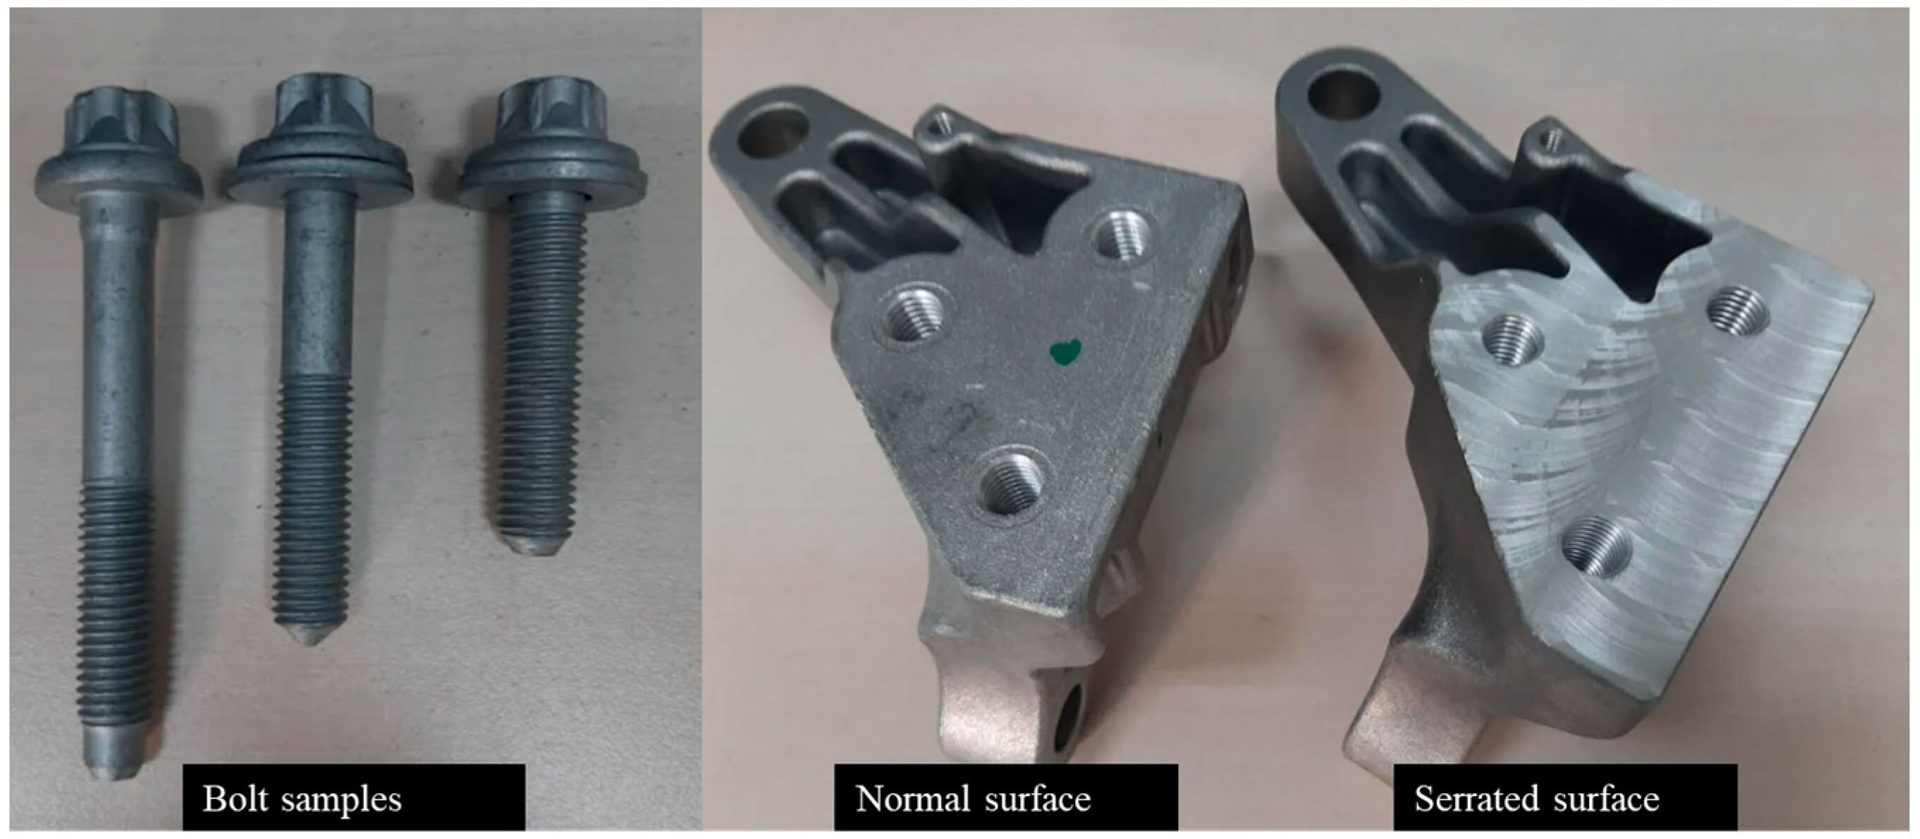
This image shows the bolt and female thread specimens used in the experiments. Photo courtesy TOFAŞ Türk Otomobil Fabrikas AŞ
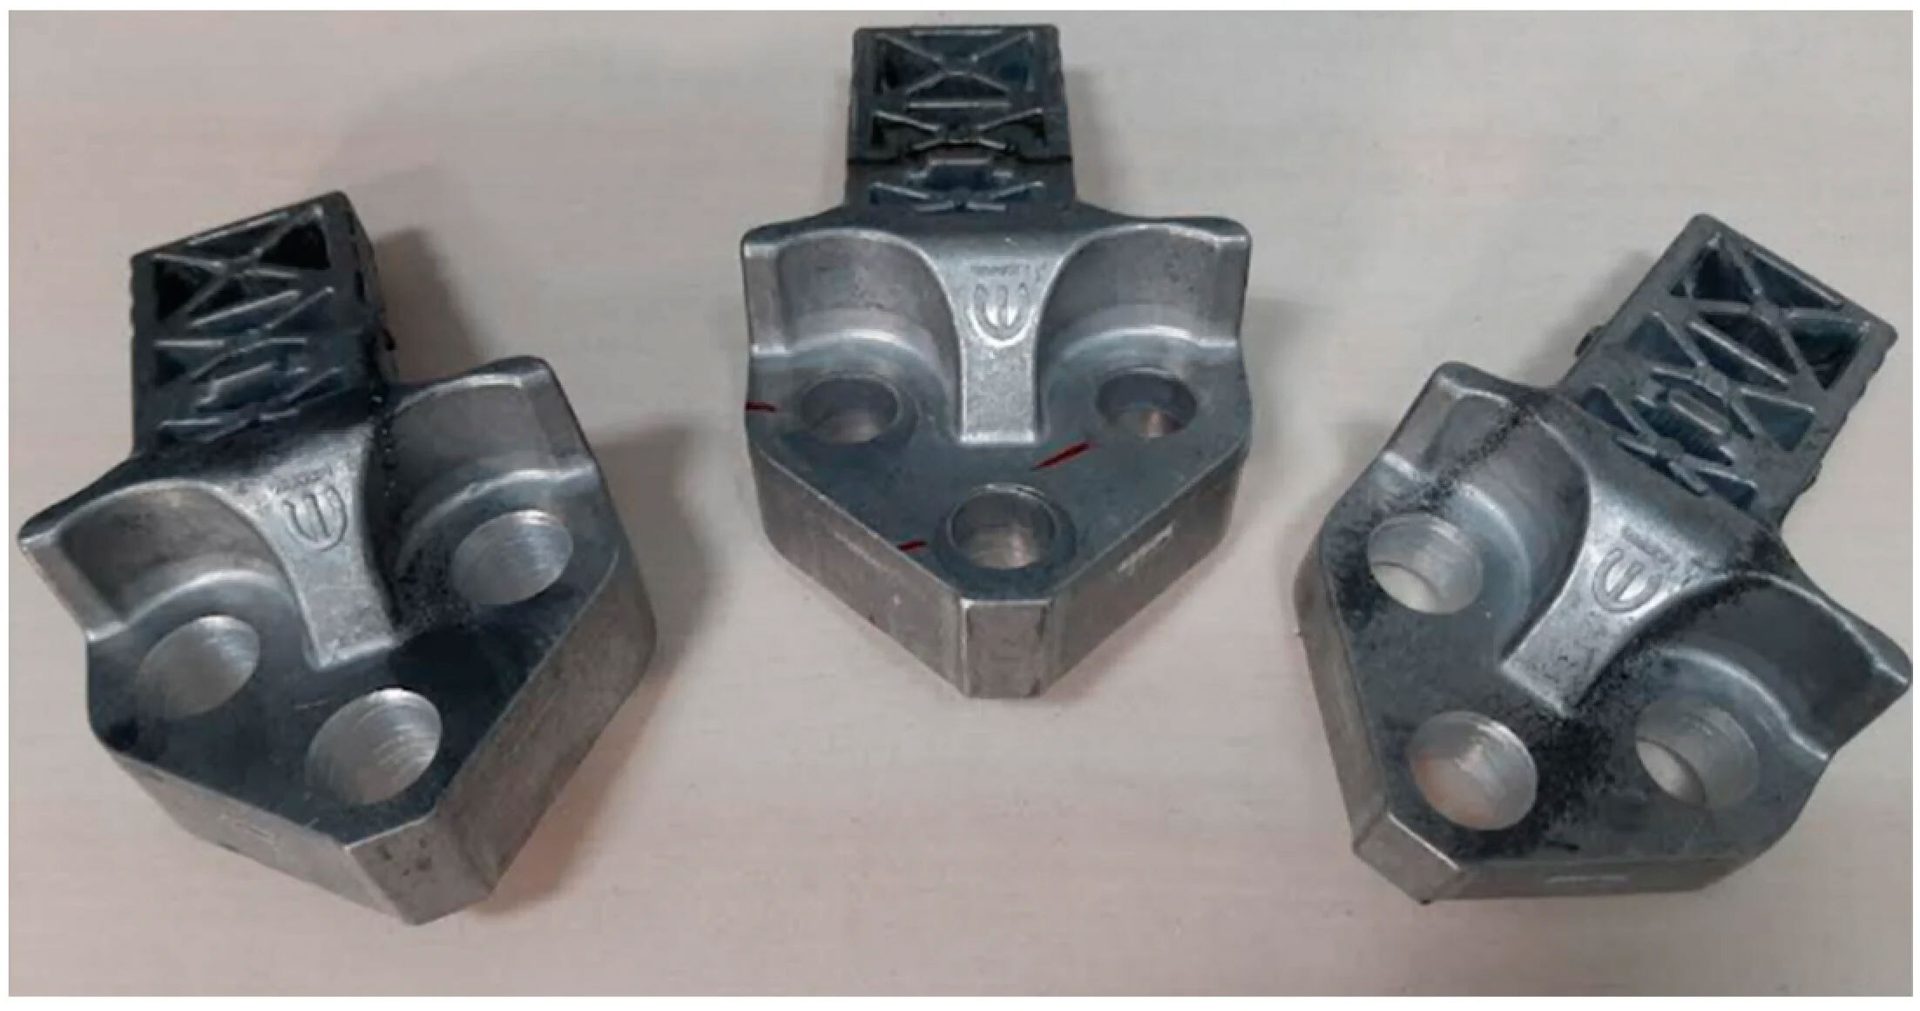
This image shows the connecting parts with different hole diameters and thicknesses. Photo courtesy TOFAŞ Türk Otomobil Fabrikas AŞ
Creating the Neural Network
A neural network is an AI technique that is used to establish the relationships between inputs and outputs of black-box processes. Neural networks are widely used to solve complex problems with hidden layers by performing nonlinear matching between inputs and outputs.
In our study, we developed a neural network model to predict loosening rates by creating LM and BR algorithms, depending on the experimental results. The neural network was used as a surrogate model to examine the effects of the variables. Surrogate-based prediction and optimization methods play an important role in prediction and optimization processes, especially when the process model is complex and established using computationally expensive simulations.
Matlab software was used to develop the neural network model, which is composed of three layers. Our model has seven input neurons, 3 to 15 neurons in the hidden layer, and one output neuron. The factors considered by the model were as follows: clamp force, radial displacement, clamping length, surface condition between parts, joint rigidity, working thread length, and bearing area.
MSE values were examined to find the best neural network structure. The model was designed with 30 data points, which were obtained via the design of experiments. A total of 70 percent and 15 percent of these points are used for training and testing.
Cross-validation is a statistical technique to evaluate networks by partitioning the data into subsets of specified ratios. In this study, the leave-one-out method for cross-validation was used by partitioning the data into subsets, which were the data used for the test, validation, and neural network model training.
The reason for choosing MSE and R-value is to prevent overfitting and increase accuracy. R-values were recorded for training and testing. For high accuracy of the model, the R-value should be as close to 1 as possible. All R-values for neural network architectures were calculated between 0.91 and 0.98. The training was realized with Bayesian regularization, and the performance was in terms of the MSE and Pearson coefficient of determination.
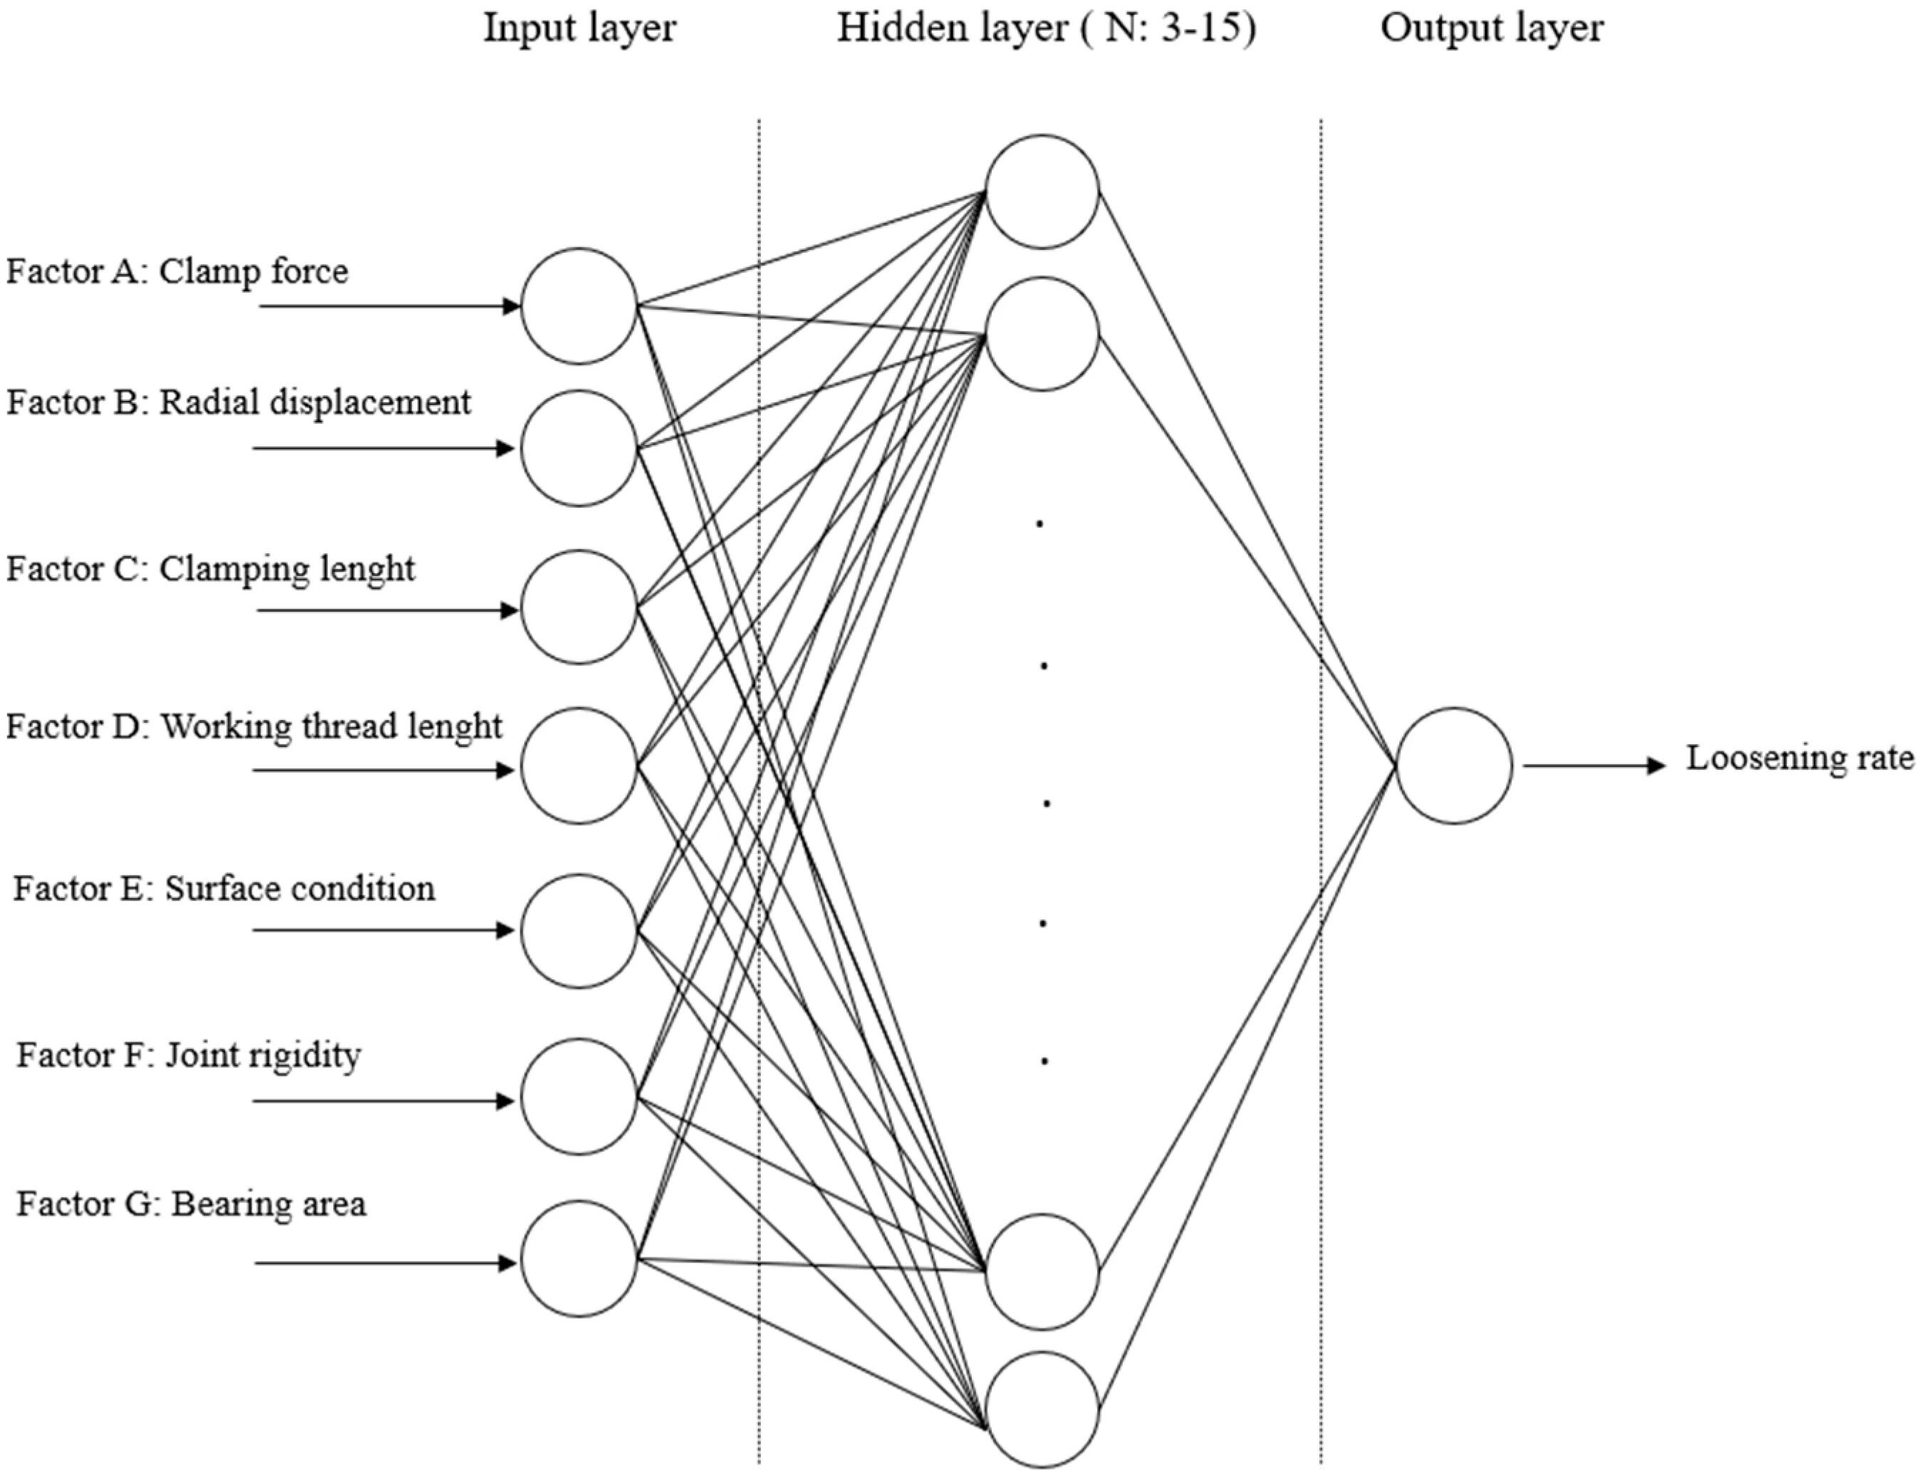
The researchers developed a neural network to predict the loosening of bolted joints. Illustration courtesy TOFAŞ Türk Otomobil Fabrikas AŞ
Result and Discussions
The first 16 results were used for training and cross-validation, and the remaining three results were used for the test. One result was left out for cross-validation, and the remaining 15 results were used for training. The number of epochs was chosen as 20 for both approaches.
The regularization parameter was chosen as 0.5 for LM back-propagation modeling. The training value represents the learning status of the algorithm, which is the difference between outputs and training status. The MSE represents the error for each architecture. The learning rate parameters were set as Matlab default values, i.e., 0.001 for LM and 0.005 for BR.
Although the experimental results were trained using LM, BR and scaled conjugate gradient (SCG), training with LM and BR gave better results. In this study, in addition to the number of epochs, the learning rate was also changed, and experiments were conducted by choosing five, eight, 10, 15 or 20 epochs and choosing different learning rates for each epoch on the basis of improvements in the results, without overfitting, to find the best neural network.
LM gave the best results with the 7-5-1 architecture. LM is a widely used and recommended training algorithm for most problems. SCG was not a proper training algorithm for the bolt loosening prediction problem. BR gave the best results with the 7-13-1 architecture. Although BR gave better results than LM in some other cases, the LM method is ideal for the bolt loosening problem.
In the case of Taguchi analysis, Tests 17, 18, and 19 were computed with error rates of 7.5 percent, 13.4 percent and 2.8 percent, respectively. However, the neural network model with a 7-5-1 architecture achieved predictions with better error rates, especially for Tests 17 and 18 at 0.11 percent and 2.45 percent, while test 19 was computed at a 3.17 percent error rate. Although the error rate using the Taguchi method was better for Test 19, the error rate using the neural network was not much different from the Taguchi estimation method.
The results show that a neural network approach gave quite good results to predict bolt loosening.
In traditional product development processes, joint design and design validation processes take a long time and involve many repetitive test plans. Loosening tests take at least one week. Moreover, in the case of unexpected situations, the tests must be repeated.
Ouir method enables an experimental-based calculation and estimation approach, reducing the loosening test requirement by approximately 50 percent with respect to MAST testing, which is regularly carried out in product development. In this way, improvements can be achieved in terms of time and cost for the durability tests to be carried out for new fastener development, as well as cost reduction and mitigation studies.
Based on our results, we conclude the following:
• Radial displacement, clamp load and the surface conditions of connected parts were the parameters with the greatest influence on the self-loosening of bolted joints.
• The radial displacement acting on a bolted joint had the greatest effect on the loosening of bolted joints. If a joint is subjected to a high radial displacement, it is important to determine other influential parameters to prevent loosening.
• According to Taguchi analysis, increasing the clamp load, working thread length between male and female threads, bearing area, and serrated surface condition between the connected parts would reduce the loosening rate of the bolted joint.
• AI can be used to predict the mechanism of self-loosening and the behavior of bolted joints without additional tests.
Editor’s note: This article is a summary of a research paper co-authored by Özgür Şengör, Onur Yavuz and Ferruh Ozturk, Automotive Engineering Department, Bursa Uludağ University in Bursa, Turkey. To read the entire paper, click here.

ASSEMBLY ONLINE
For more information on AI and fastening, visit www.assemblymag.com to read these articles: