MONTH 2023

Test and Inspection
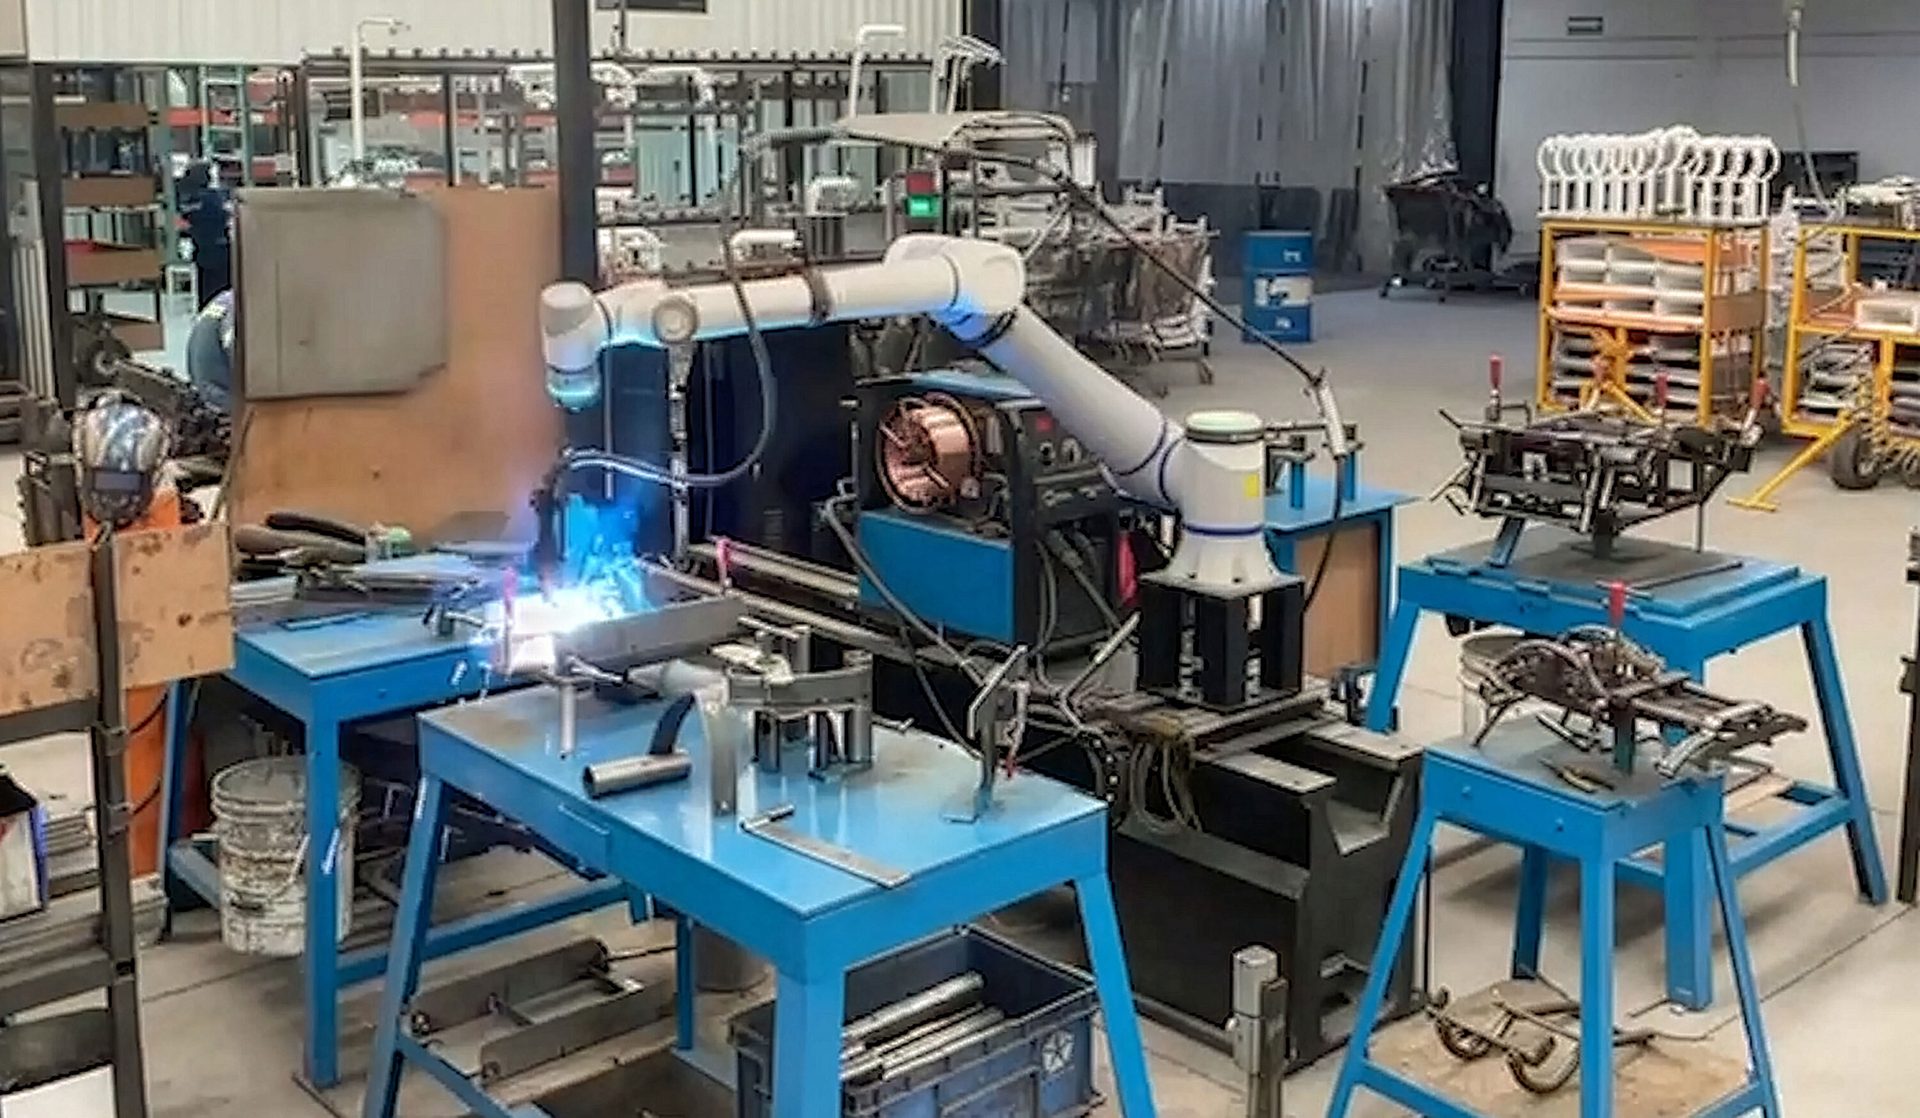
Labor shortages are driving new demand for automation.
Options for Screwfeeding
In manufacturing, you can’t improve what you don’t measure. But what metrics make the most sense? Photo courtesy Collins Aerospace
The right key performance indicators can help engineers improve the performance of their assembly lines.
Measuring What Matters:
An Engineer’s Guide to Manufacturing KPIs
Herman Tang, Ph.D. // Professor of Engineering // Eastern Michigan University // Ypsilanti, MI // htang2@emich.edu
For engineers and operations managers seeking to improve production performance, selecting the right throughput metrics is critical. This article outlines practical measurement approaches to help monitor, diagnose and improve your manufacturing operations.
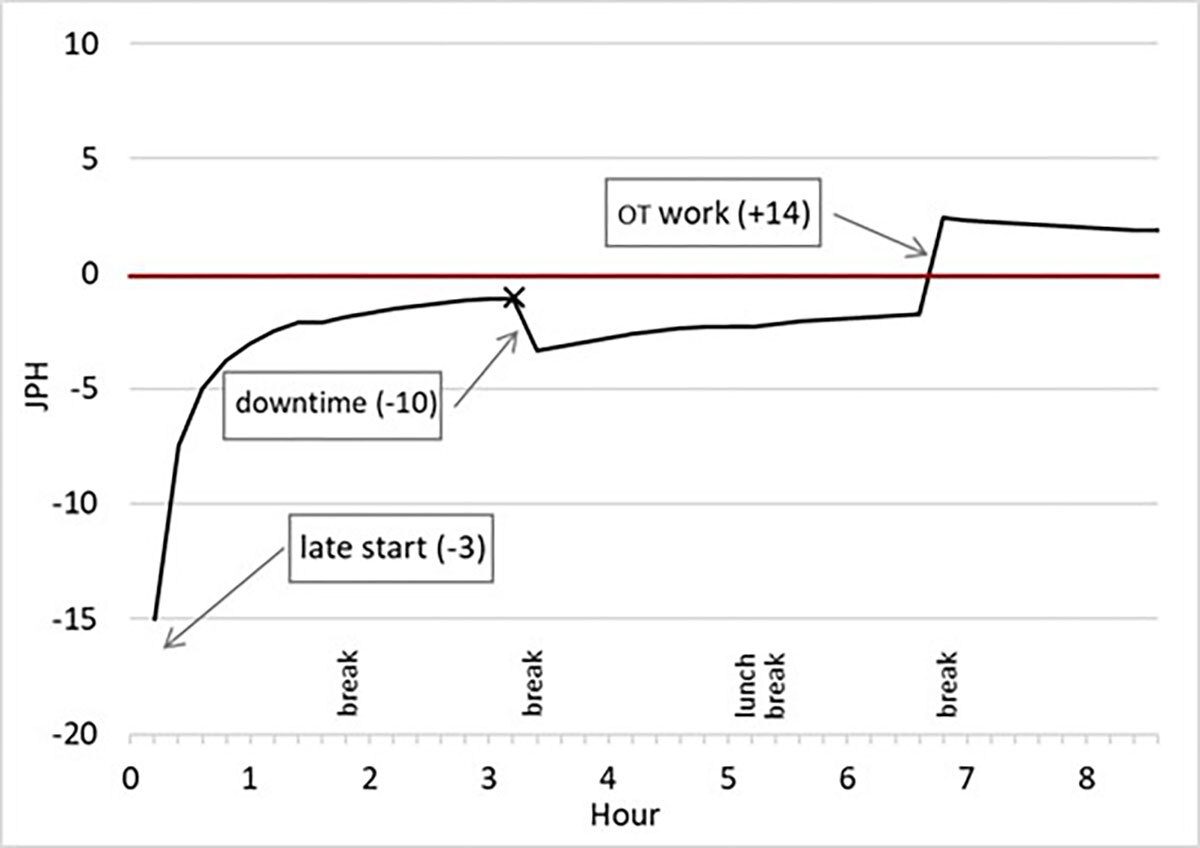
Throughput rate—often expressed as jobs per hour (JPH)—captures real-time variation in production. In this example, three events are evident: a late start (-3 units), a breakdown (-10 units), and overtime recovery (+14 units). Photo courtesy Eastern Michigan University
Start with Direct Throughput Indicators
Direct throughput indicators provide immediate visibility into production output. Although simple, they form the foundation for operational decision-making and must be applied correctly to generate actionable insights.
Units produced per shift (e.g., 500 units) offer a quick comparison against targets. However, the indicator typically includes nonconforming units. Thus, production count alone, as total output or gross throughput, does not distinguish between conforming and defective output, which can distort performance interpretation.
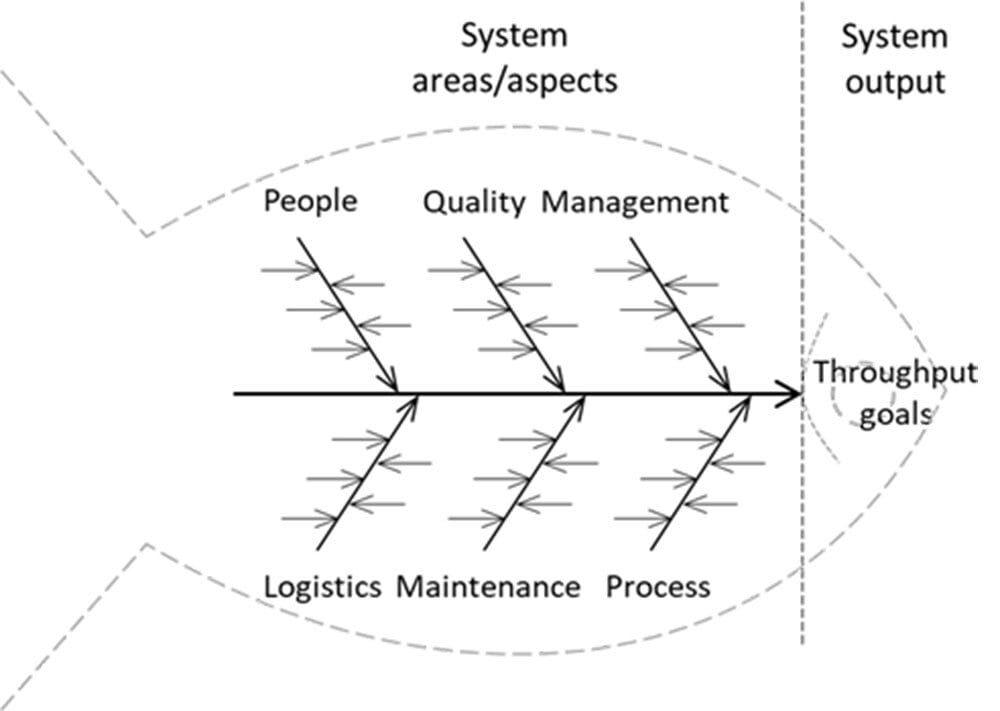
Throughput performance is affected by multiple operational factors. Photo courtesy Eastern Michigan University
Throughput rate—often expressed as jobs per hour (JPH) or units per time unit—captures real-time variation. Unlike cumulative counts, rate tracking reveals performance fluctuations during a shift.
Figure 1 illustrates an example of a throughput rate deviation chart over a shift. In the example, three events are evident: a late start (-3 units), a breakdown (-10 units), and overtime recovery (+14 units). Overall, the shift achieved its target; however, it did so at the expense of significant overtime costs.
Action: Use production counts for overall results and JPH deviation charts for performance diagnostics. When inline inspection is available, exclude defective units from both metrics.
Table 1
Measure Both Volume and Time
Throughput performance depends on both output volume and time efficiency.
Volume attainment (VA) is simple to calculate: VA = (actual produced units) / (planned output units).
VA measures output achievement. If 500 units are planned and 475 are produced: VA = 475/500 = 95 percent. However, VA ignores time consumption. Achieving 95 percent output in 110 percent of planned time differs significantly from achieving it within 95 percent of planned time.
Schedule attainment (SA) is also easy to calculate. It integrates quantity and time:
SA = VA × [(planned production time) / (actual production time)].
SA incorporates both quantity and time, revealing rate performance. The relationship SA = VA / A (where A is system availability) proves instructive.
Table 1 lists three scenarios with measured VA, SA, and A values as an example. From this table, system 5 represents normal performance. System 6 exceeds targeted level. Engineers should determine whether such performance is sustainable and whether it has any effect on product quality. System 7 suggests unreported overtime, since availability exceeds 100 percent.
Action: Monitor VA and SA together. Divergence signals time efficiency issues, requiring additional investigation. Values exceeding expectations warrant validation and investigation.
Table 2
Implement Structured KPI Frameworks
Throughput performance is affected by multiple operational factors. Effective measurement requires structured key performance indicator (KPI) frameworks spanning six critical areas rather than two or three isolated metrics.
To comprehensively capture multiple dimensions of production performance, various metrics or KPIs are typically needed. Table 2 shows an example of KPIs across six areas for a high-volume production environment.
Measurement priorities will vary depending on the manufacturing environment. For example, process industries might measure heat transfer rates or flow stability. Energy-intensive operations might measure energy efficiency. Assembly plants should measure cycle time and line balance.
The ISO 22400:2014 standard (reviewed and confirmed in 2025) defines 34 manufacturing KPIs and offers structured guidance for their selection. Table 3 lists these KPIs across four categories. Twelve of them are directly related to production throughput. Operations management should evaluate these KPIs in light of their specific operations. Developing new KPIs may be necessary, but it requires a lot of additional effort.
Action: Audit your current KPI portfolio against ISO 22400 standards. Identify gaps in coverage across production, maintenance, quality, and inventory domains. A phased improvement approach is recommended.

Data integrity is critical to the success of any effort to implement key performance metrics. Stakeholders will only act on numbers they trust. Photo courtesy Wolf Appliance Inc.
Build a Phased Measurement Strategy
Effective throughput measurement requires a phased approach. Do not attempt a total system overhaul at once; instead, deploy metrics in three strategic tiers.
Phase 1 establishes a foundations. Start with production count and throughput rate (TR) to establish reliable data baselines.
Phase 2 brings in efficiency measures. Layer in volume attainment (VA) and schedule attainment (SA) to detect hidden time-leaks and unreported overtime.
Phase 3 brings in more targeted frameworks. Expand into comprehensive KPI frameworks based on your specific pain points. If quality is the bottleneck, prioritize first pass yield. If downtime is the culprit, focus on availability and mean time between failures.
When selecting and implementing KPIs, there are three pillars of success:
• Data integrity: Stakeholders act only on numbers they trust; prioritize data validation first.
• Actionable triggers: Each KPI should promote a predefined response when thresholds are breached.
• Continuous refinement: Review the KPI portfolio regularly (e.g., quarterly) to ensure alignment with evolving operational objectives.
Mastering these fundamentals enables the transition from reactive firefighting to proactive, predictive performance management.
Key Takeaways for Implementation
• Start simple: Use production count and throughput rate as your foundational metrics.
• Watch the gap: Monitor VA and SA together; divergence between them is your first warning sign of time-efficiency losses.
• Standardize: Align your KPI selection with ISO 22400 to ensure industry-standard coverage.
• Own the results: Establish clear cross-functional ownership across production, maintenance and quality teams.
Editor’s note: This article was adapted from Chapter 2 of the author’s latest book, Manufacturing System Throughput Excellence (Wiley, 2024).
ASSEMBLY ONLINE
For more information on manufacturing management, visit www.assemblymag.com to read these articles: